SIP or systematic investment plan may seem like any other simple three-letter word. But this word, which is easy to remember, spell and pronounce, has now become an intrinsic part of any conversation related to investments. And when we talk of SIPs, a discussion on the best mutual funds (MFs) is obvious.
In fact, the pace of acceptance of MFs has gone up drastically in India in recent years. The Rs 43.20 lakh crore industry has witnessed a remarkable rise in the number of investor accounts. From December 2014 to March 2023, the number of investor accounts has increased from 40.3 million to 145.7 million. Though the numbers have grown consistently, a spurt was seen in the last two years as the industry added a little more than 50 million accounts from June 2021 to March 2023. This surge in investor accounts reflects the growing awareness and acceptance of mutual funds as a preferred investment avenue among Indian investors.
Most of such subscribers usually invest through distributors—online platforms or agents—and may not have the wherewithal to cross-check whether the choice their agents have made on their behalf is right. Outlook Money’s India’s Best Funds 2023 issue can play a crucial role by arming them with information and analysis that can help them evaluate funds.
Why We Did It?
The consistent rise in MF investor accounts can be attributed to multiple factors. First, investors have become more conscious about the need to diversify their investment portfolios beyond traditional options like fixed deposits and real estate.
Second, the SIP investments can have low-ticket sizes, which has played a pivotal role in attracting new investors. SIPs allow individuals to invest small amounts—even as low as Rs 500—at regular intervals, thus making it affordable and convenient for retail investors to participate in the markets.
Third and possibly the most crucial factor is the performance of schemes. The MF industry has witnessed a notable transformation in its growth trajectory. Previously, the industry relied heavily on distribution networks and aggressive marketing to drive growth. However, in recent years, there has been a shift towards performance-led growth, wherein the focus has shifted to delivering consistent and superior returns. This shift could be attributed to the recognition that superior performance attracts investors and contributes to the growth of the total assets under management (AUM).
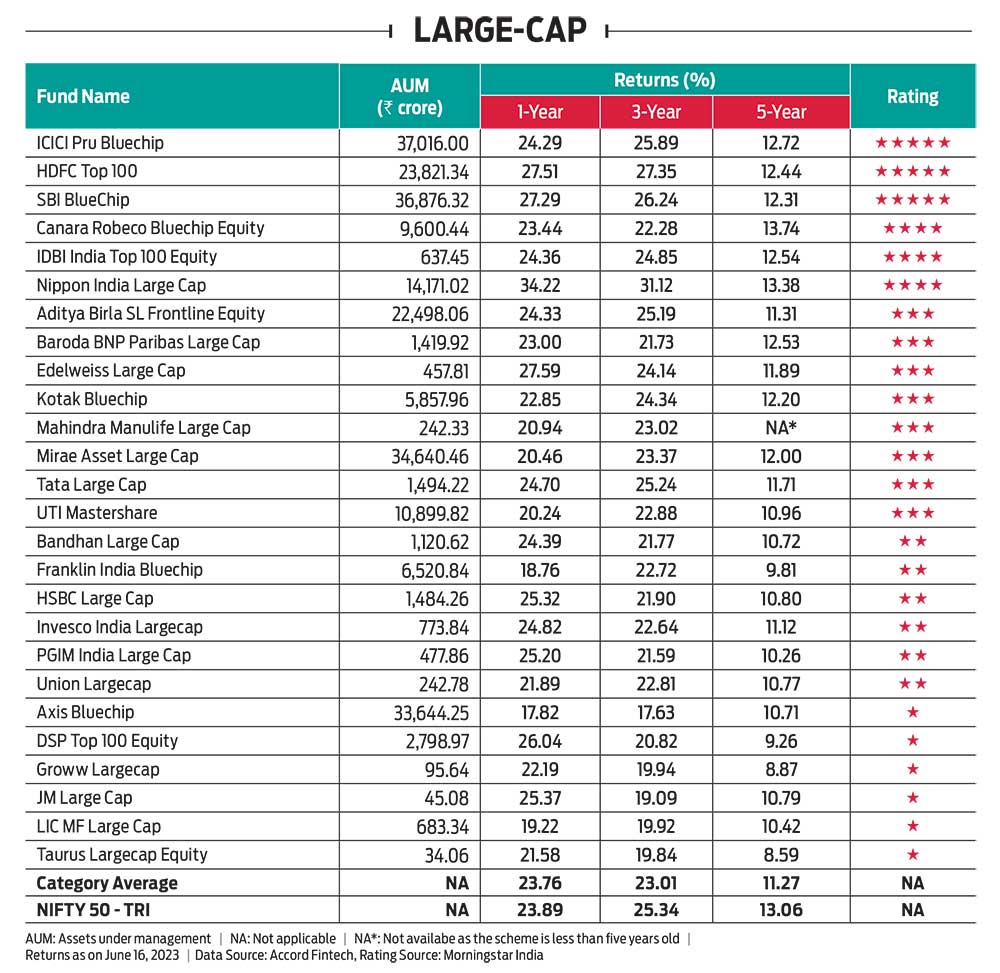
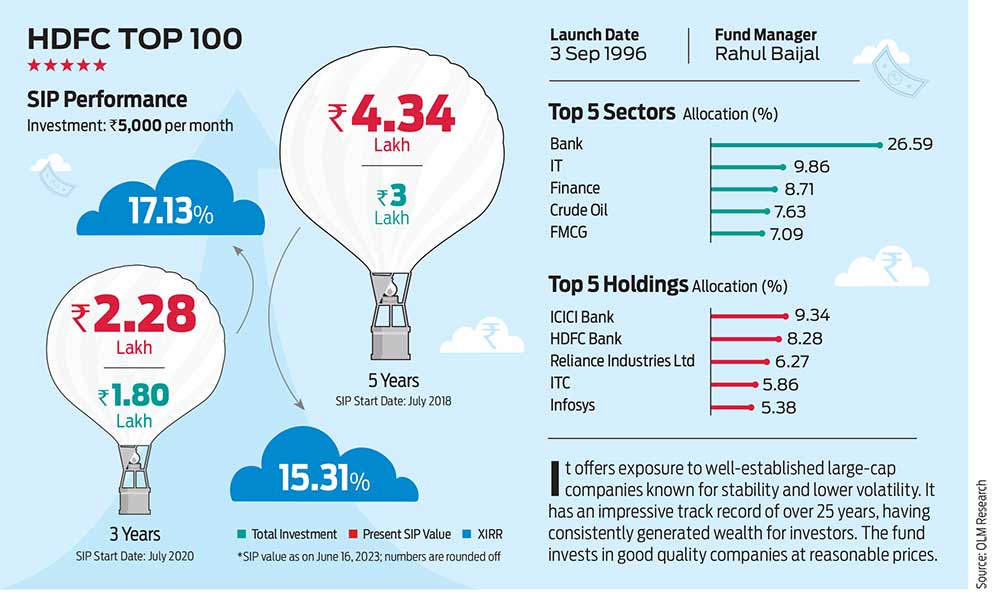
We also ran some numbers to understand how performance attracts investors. We took three popular schemes and analysed their fund size over net asset value (NAV) from May 2022 to May 2023. These three schemes are ICICI Prudential Bluechip (which has done well in the last 3-5 years), HDFC Top 100 (which was not doing well for a brief period, but has picked up in the last three years), and Axis Bluechip (which has delivered superior returns in the past, but isn’t doing well in the current cycle). We chose funds with different periods of performance spurt to ensure neutrality in the findings.
During this period, HDFC Top 100’s NAV grew by 16.55 per cent, while the AUM grew 15.22 per cent. ICICI Prudential Bluechip’s NAV grew by 13.43 per cent, while its AUM was up 19.57 per cent. However, Axis Bluechip saw a fall of 0.57 per cent in its AUM and saw only a 2.8 per cent growth in its NAV. This indicates that schemes that are seen to be performing well attract investors. It also shows that investors have become more aware, seek transparency, and are actively evaluating fund performance before making investment decisions.
How We Did It?
We followed a quantitative approach to avoid any bias. Our rating partner for the exercise—Morningstar India—does its ratings on the basis of three-year performance of the schemes (See Morningstar Rating Methodology).
Initially, there were 36 fund categories, according to the Securities and Exchange Board of India (Sebi) classification. These included 10 equity, 16 debt, six hybrid, two solution-oriented (retirement and children’s funds), index funds and exchange-traded fund (ETFs), and international funds. Later in 2020, Sebi added another category to the equity stable—flexicap.
Of the total 11 equity categories now, we took nine. The other two have few schemes as of now. According to data from the Association of Mutual funds in India (Amfi), equity-oriented schemes derive 89 per cent of the total assets from individual investors.
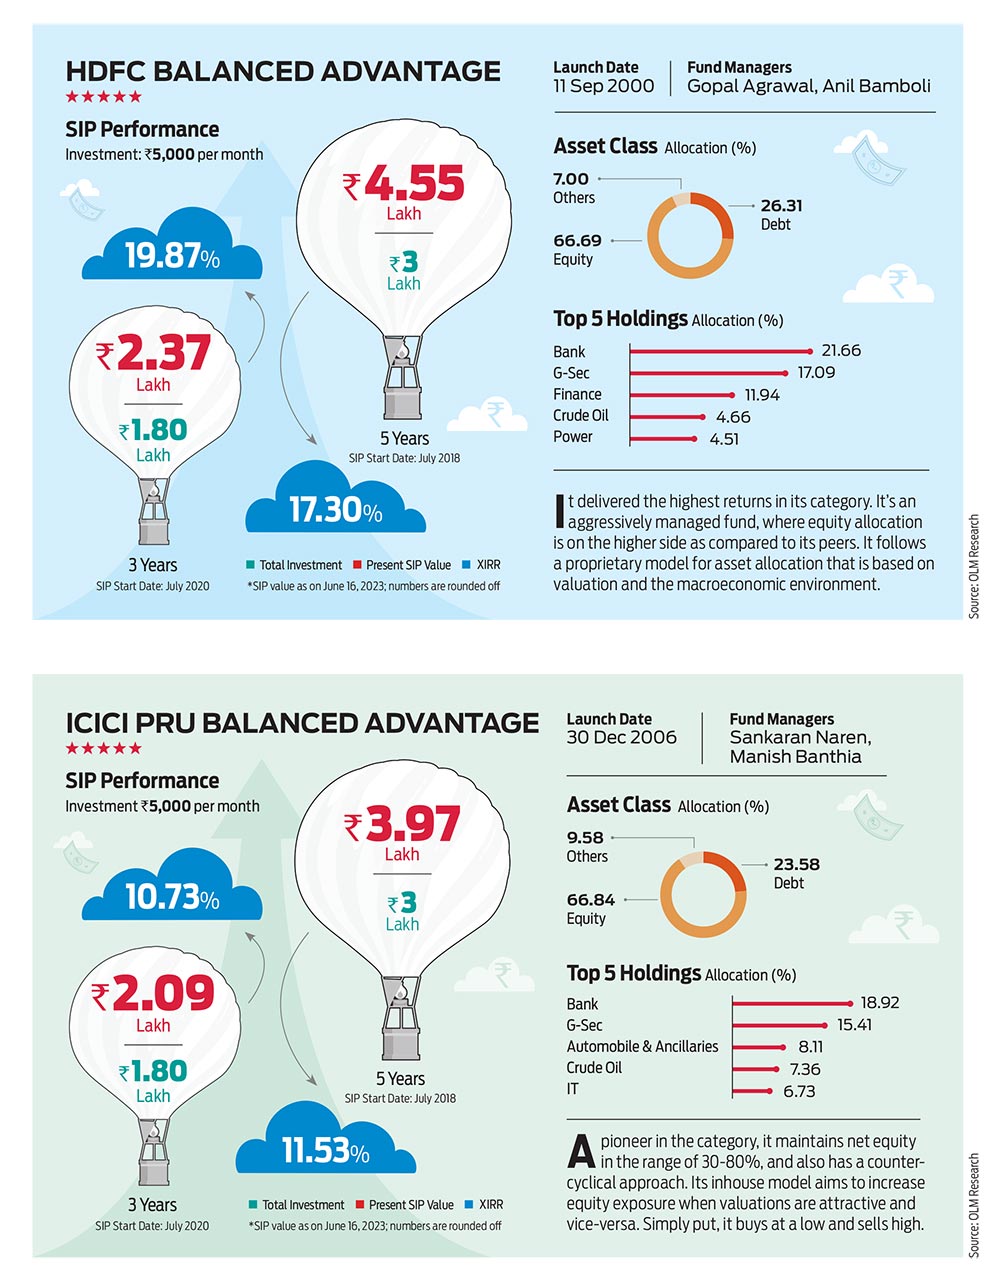
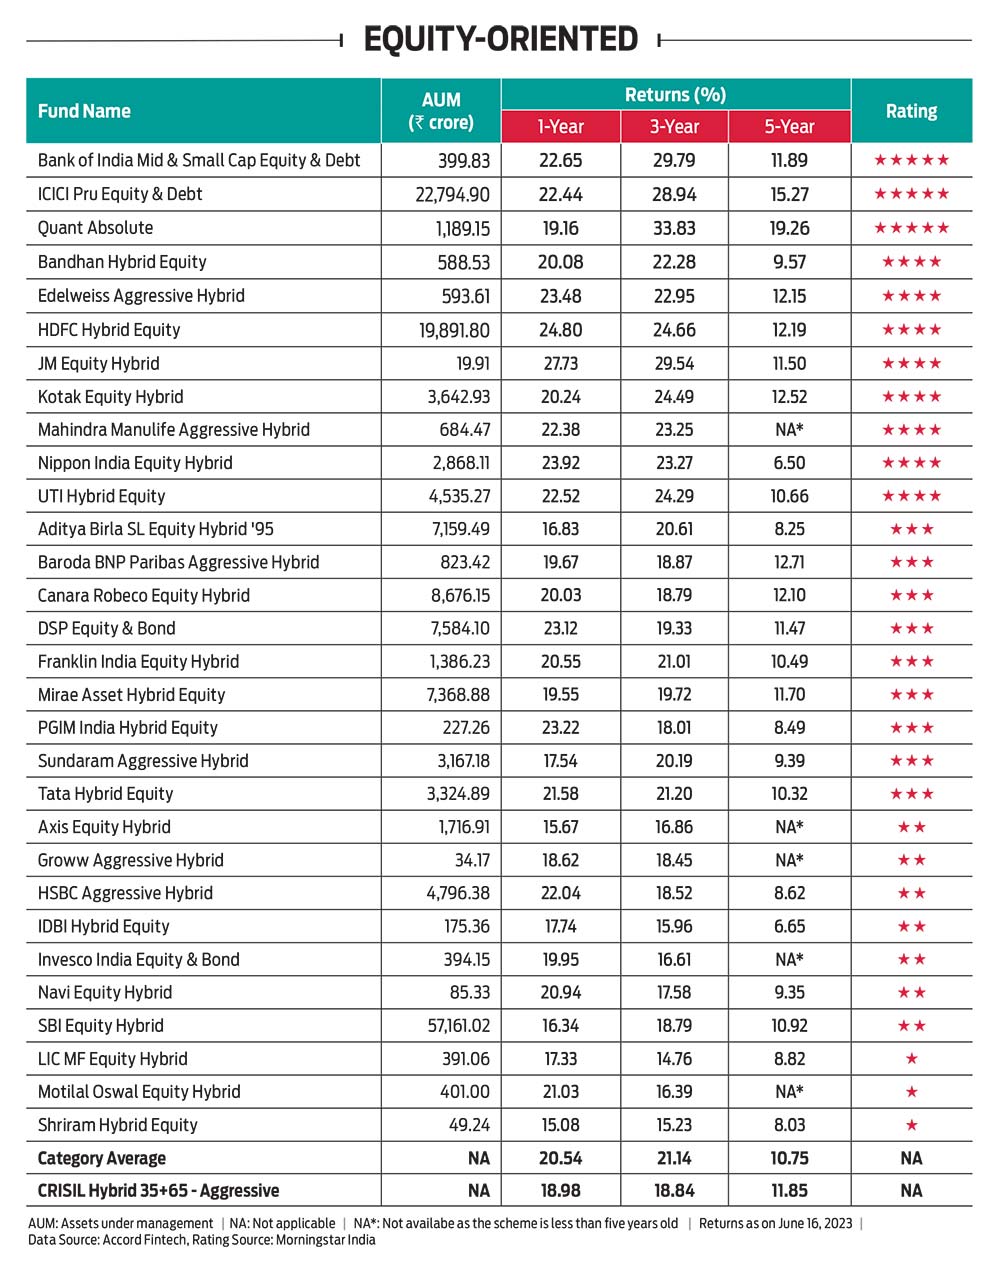
Hybrid is another category which is becoming increasingly popular among retail investors, as these funds help them balance out the volatility in the market. We included three categories from hybrid funds which have the maximum retail participation.
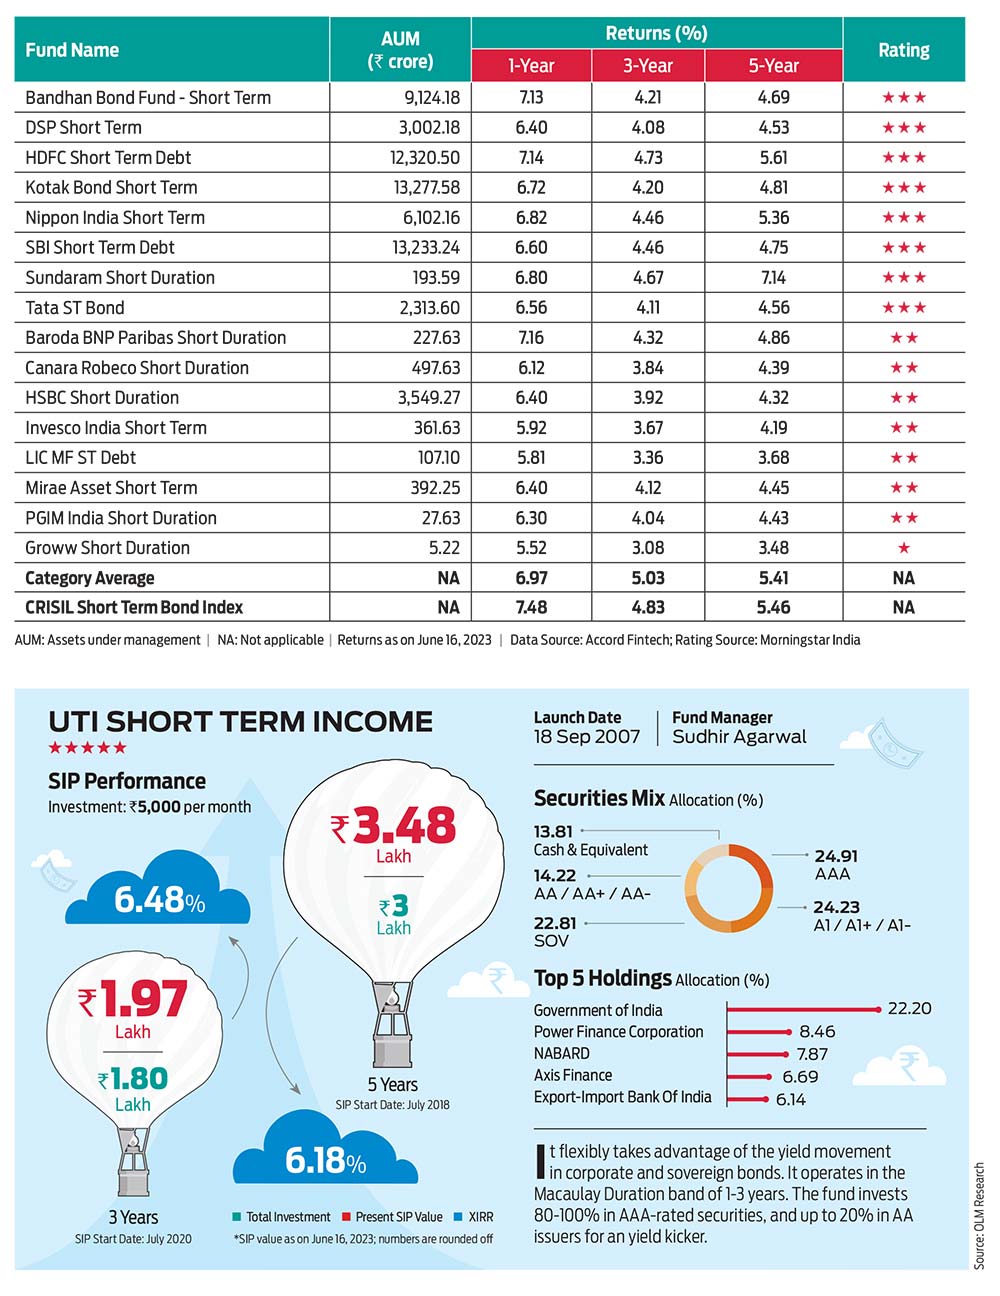
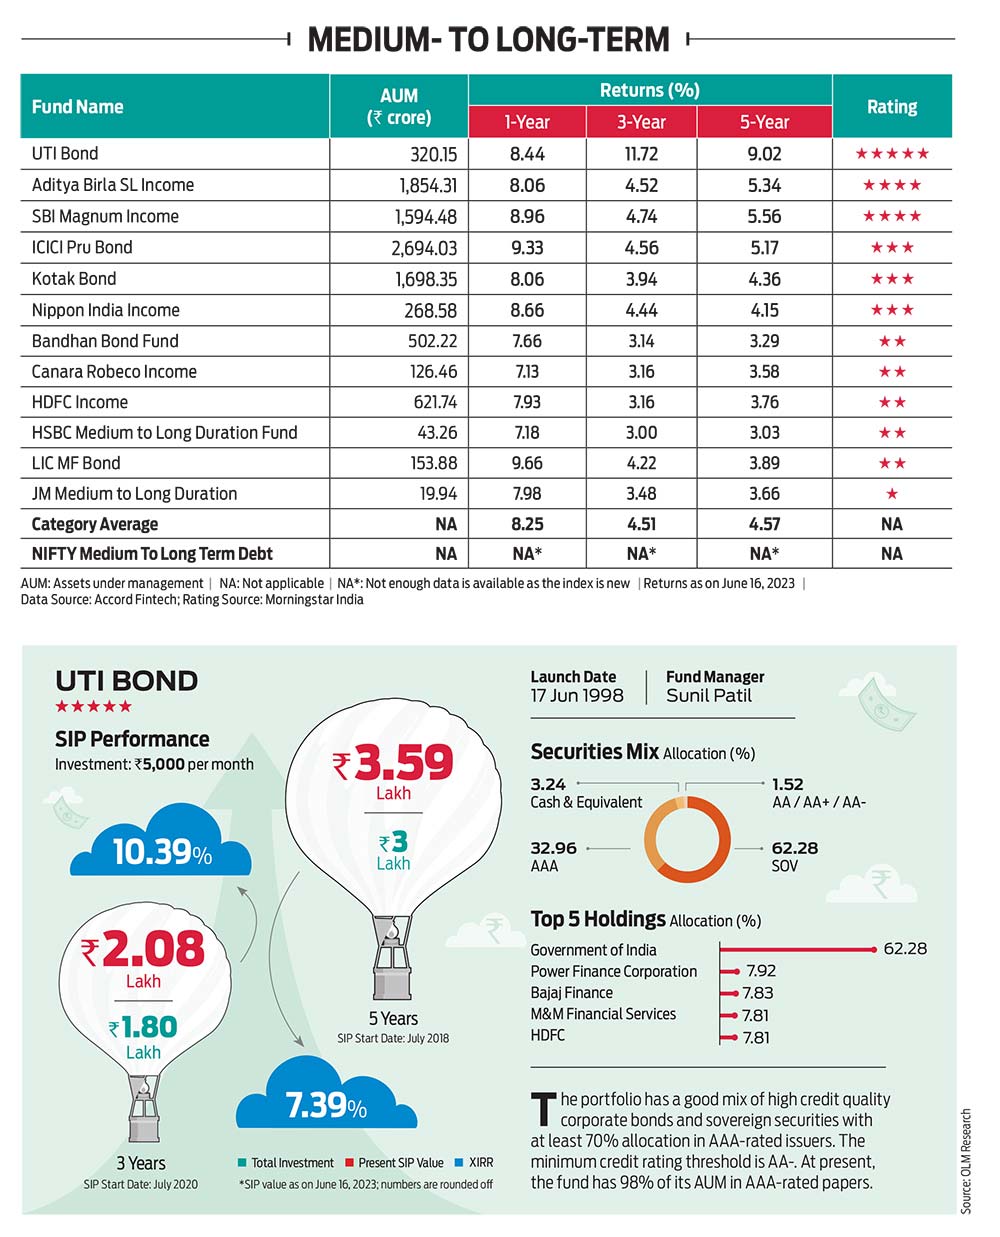
From the debt space, which is largely dominated by institutional investors, we have covered two sub-categories—short-term and medium-to-long-term—as they cover the universe in terms of duration, which is key to retail investor decisions.
While Morningstar India rated the funds, we ran the rest of the numbers ourselves to make the listing more useful for our readers.
For performance, we chose three time periods—one, three and five. Over three years, returns from most of the equity schemes are good but that’s because there is a lower base to refer to. For instance, if you consider the three-year return as on June 16, 2023, the base date will be June 16, 2020. In 2020, the BSE Sensex was at 33,605; in 2023, it has climbed to 63,384, up by 88.61 per cent in absolute terms and with a compounded annual growth rate of 23.55 per cent. Giving returns over three time periods captures both the upside and downside of the market.
What Should You Do?
Do note that this is not an investment advisory; this exercise is only meant to help you better understand how the schemes you may have invested or are planning to invest in are faring. The analysis along with the ratings will also help you make informed decisions.
If you are wondering why a second list, when Outlook Money already has an OLM 50 list, know that there are key differences between both.
The OLM 50 list does not just take quantitative aspects into consideration, but takes a deeper dive into other aspects to curate a list of handpicked funds that investors can put their money into, depending on their specific goals and circumstances.
We review OLM 50 every six months to ensure that all those funds merit a place in the list. The Best Funds 2023 issue is an annual affair and is a comprehensive coverage of all the funds in the key categories.
Morningstar Rating Methodology
Outlook Money’s rating partner Morningstar India helped us rate mutual fund schemes with an investment track record of more than three years. The cut-off date for this exercise was March 31, 2023.
The ratings are based on the funds’ risk-adjusted returns. Morningstar uses three steps to calculate Morningstar Risk-Adjusted Return (MRAR). The calculations are done on a monthly basis first and then the results are annualised. Here’s the three-step process.
Total Return: This is the first step in which the monthly total returns for the funds are calculated.
Morningstar Return: At the second step, it calculates or collects monthly total returns for the appropriate risk-free rate. It then adjusts returns for the risk-free rate to get the Morningstar Return.
MRAR: The third step in the selection process is about adjusting the Morningstar Return for risk to get MRAR. Morningstar Risk is then calculated as the difference between Morningstar Return and MRAR. On the basis of these scores, Morningstar India then assigned the star ratings. Morningstar ranks all mutual funds in a category using MRAR, and the funds with the highest scores get the most stars.
***
Equity
Among equity, only those funds seem to have given sustained returns that proactively identified growth stories in the market and moved their portfolios to those sectors and companies. The fund managers who caught the market pulse well in advance and increased exposure to the financial services, especially banks, auto and FMCG sectors and went overboard on capital goods and industrial products sectors scored. Their schemes turned out to be champions of the year. Those who failed to catch the signal early on, lost.
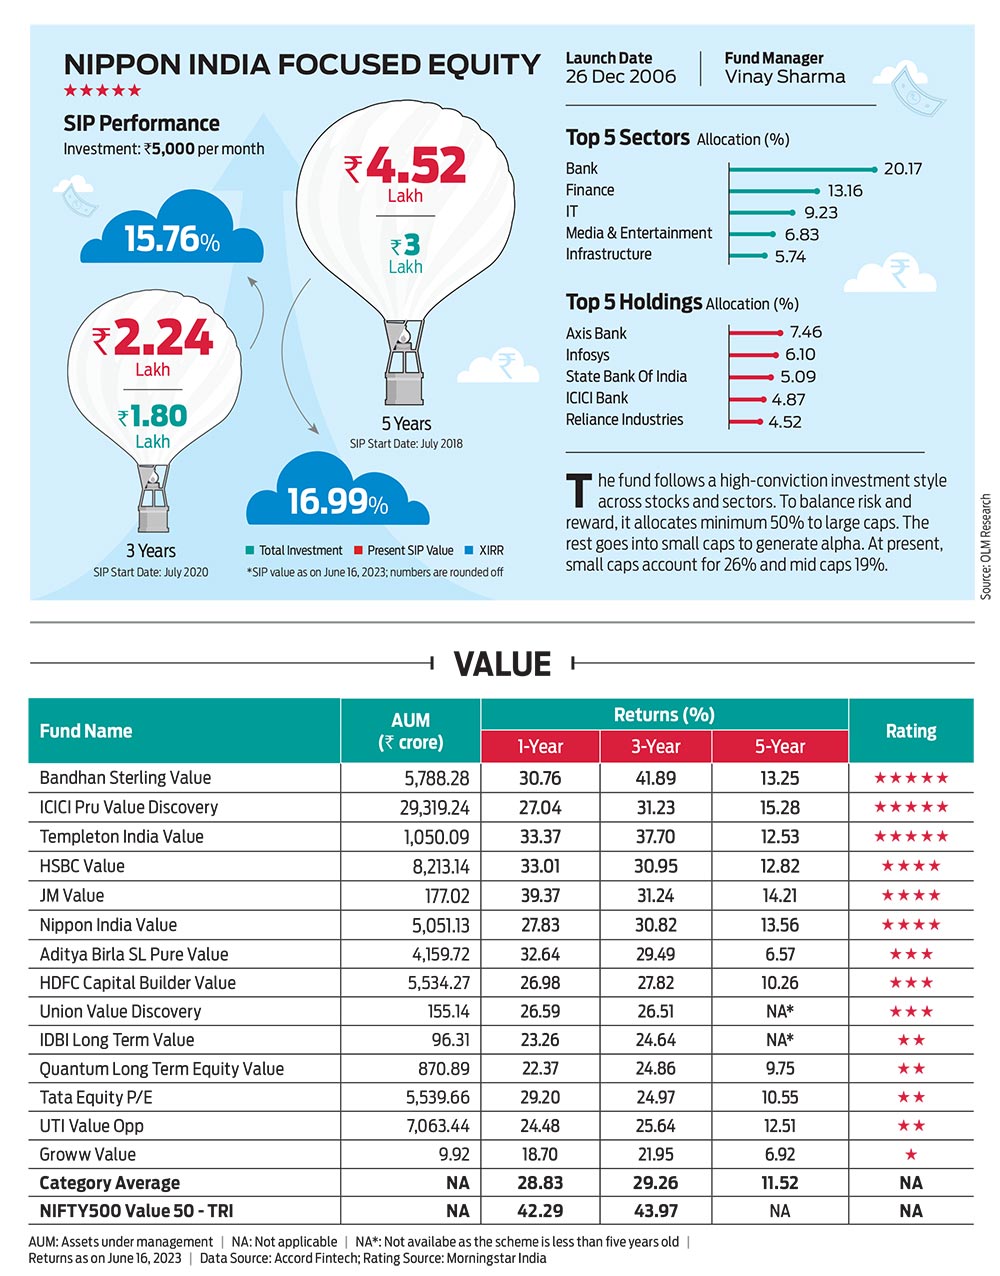
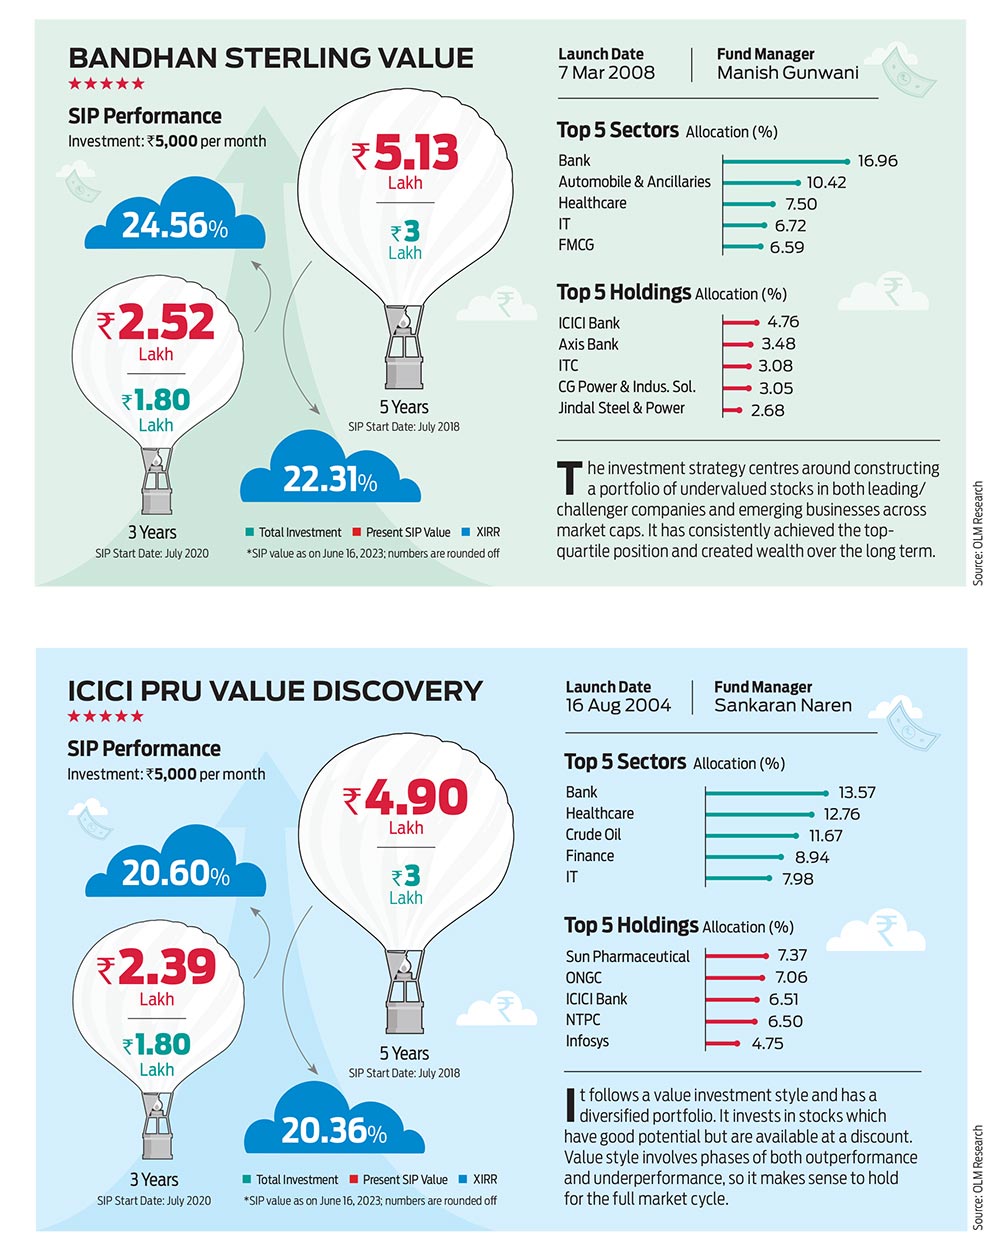
Most of the diversified funds delivered well in the last one and three years. Within the diversified category, small-cap funds stole the show by delivering the highest returns, followed by mid-cap funds. Value funds also participated in the market rally and unlocked value for investors who stayed the course over phases of underperformance and overperformance that value funds typically go through.
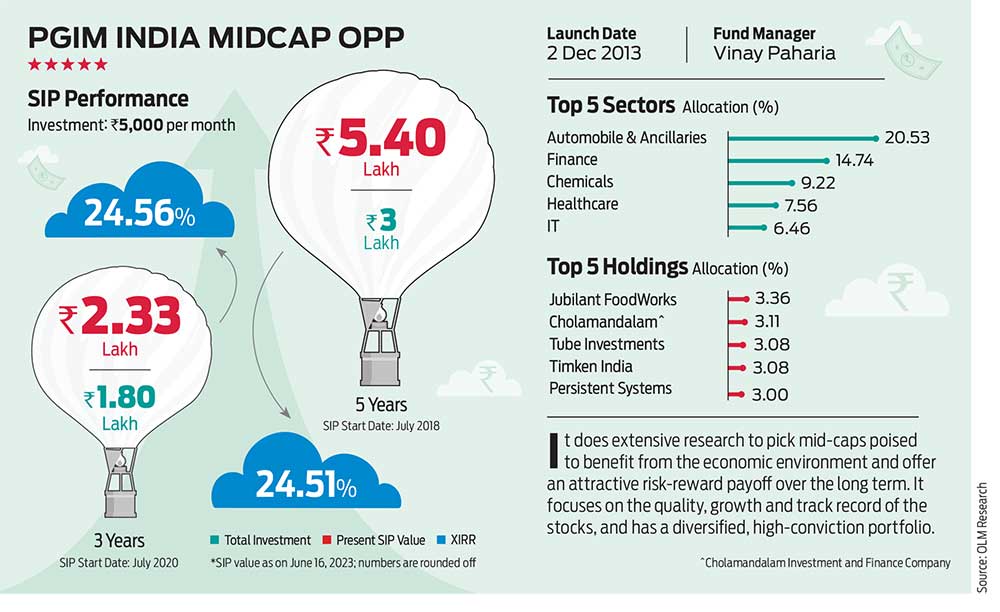
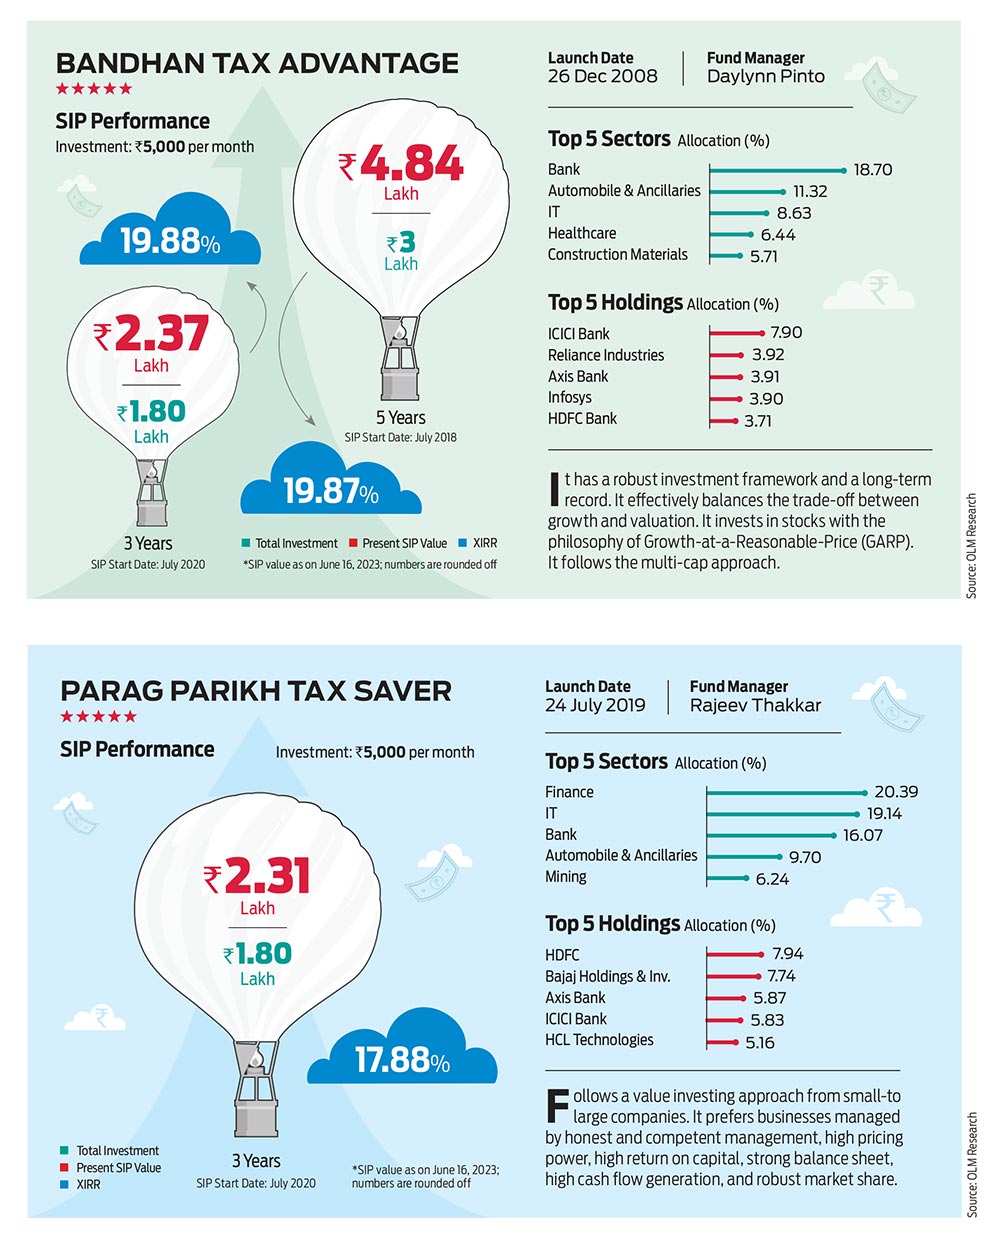
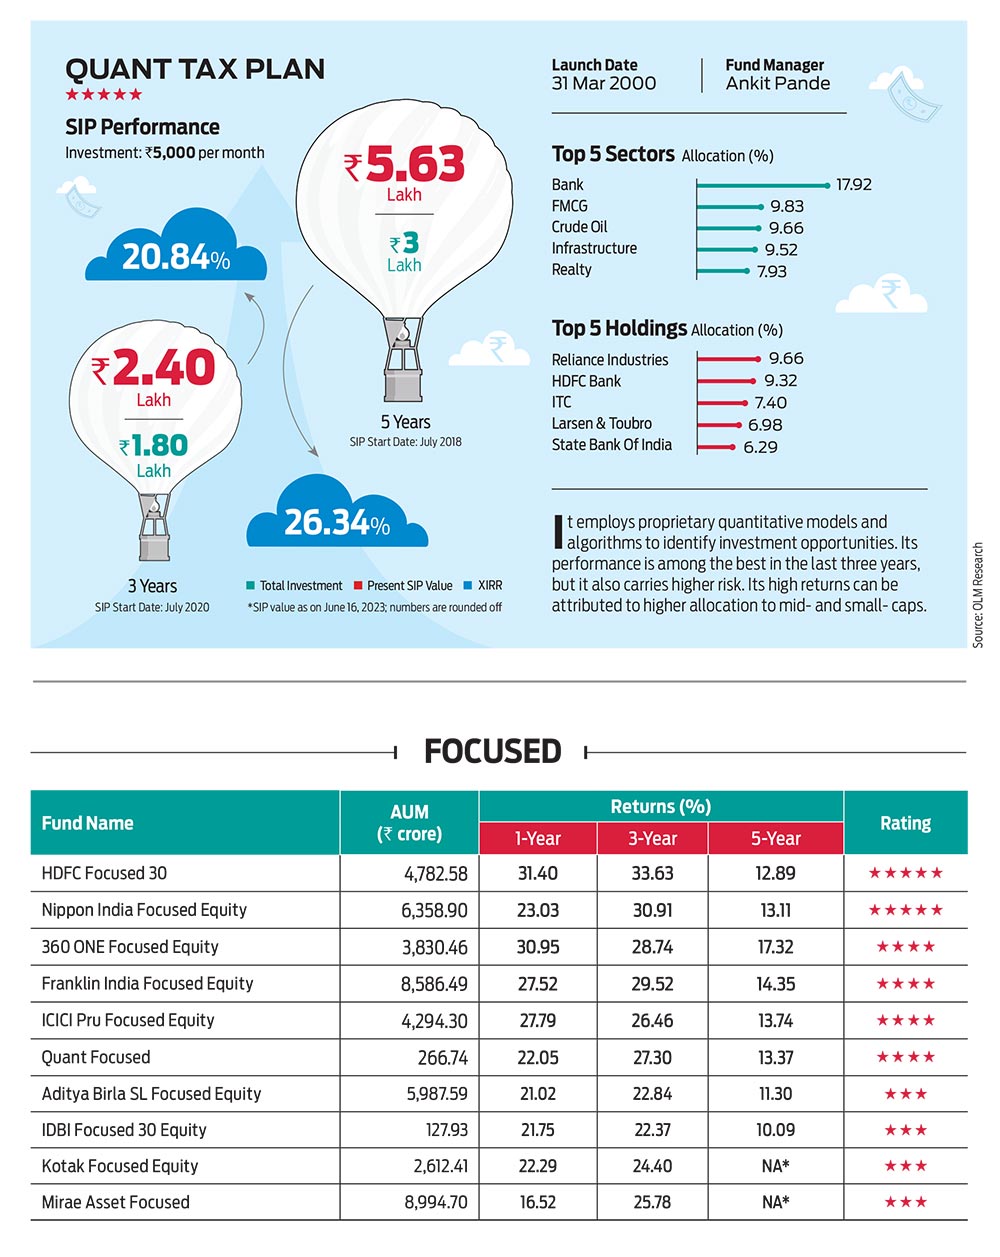
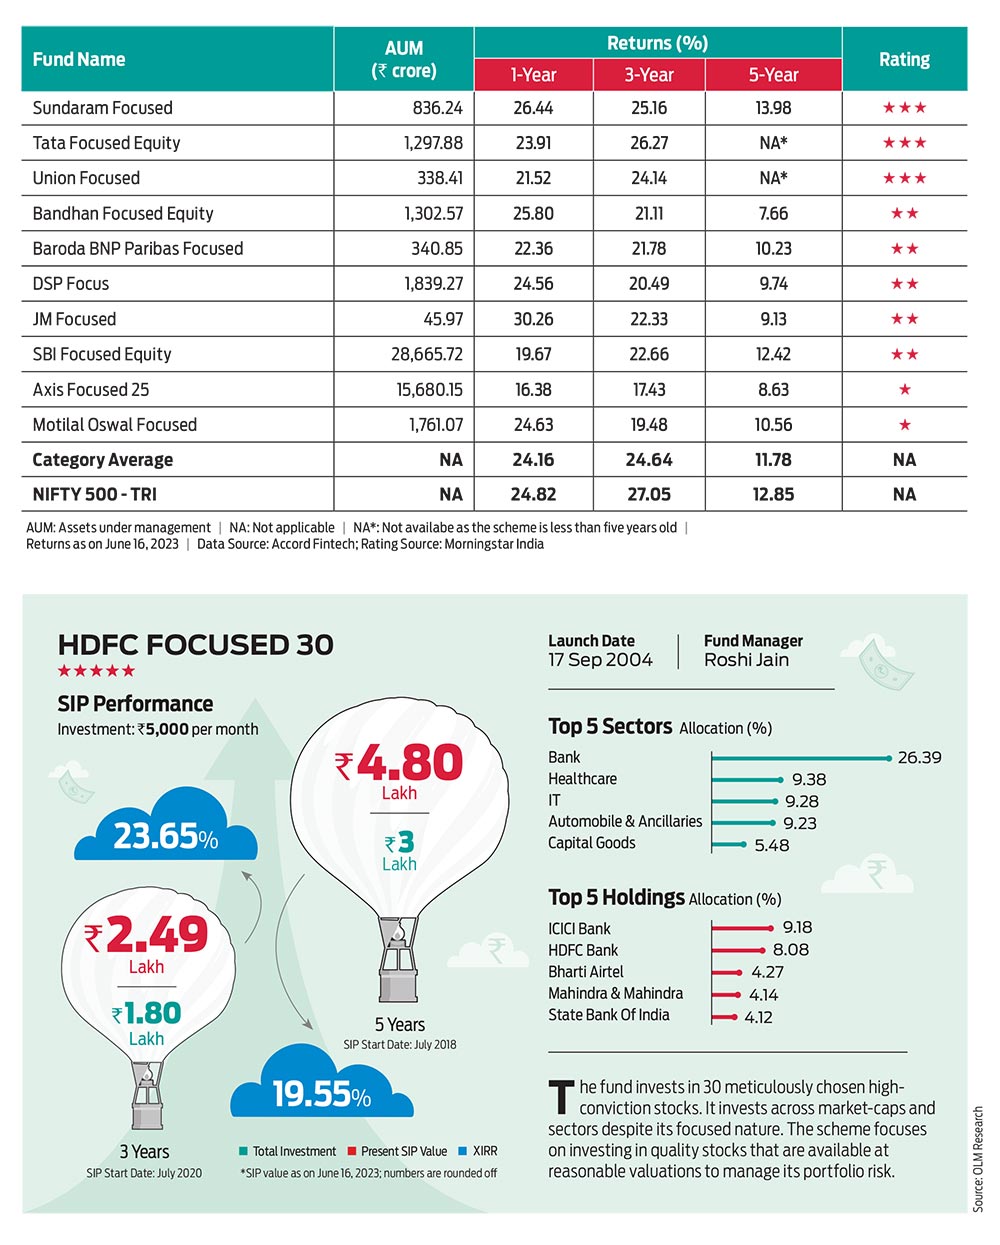
There is no best time to start your SIPs, but the past returns can give you the confidence to start now.
