
An oil spill is never a welcome site. In late July, Ecuadorian authorities confirmed an oil spill off the coast of approximately 1,200 barrels into the Pacific Ocean. According to sources, the spill happened after a state-own tank belonging to Petroecuador exceeded its maximum capacity of 188 barrels. The tank owned by Petroecuador leaked into a containment pool at Esmeralda's maritime terminal owned by Petroecuador causing the oil to move onto the beach. Approximately 4 kilometers of the beach have been impacted by the oil spill. Unfortunately, the beach area is a popular destination for tourists visiting Ecuador and locals. An investigation is underway to determine the cause of the spill. According to the company, 90% of the oil that spilled impacted land, and about 60% moved to the sea. While an oil spill of this magnitude can devastate wildlife, the impact on the broader oil markets is still unclear.
How Much Oil Does Ecuador Produce?
Ecuador is one of the oil-exporting countries in South America. In 2021 Ecuador's oil production was about 550,000 barrels per day which ranks the country as the 28th largest producer. Oil consumption in the country is about 260,000, and the balance is exported. Ecuador has oil reserves of more than 8 billion barrels, ranking the country as number 19 globally.
Ecuador is a net exporter of oil rather than an importer. Oil is one of Ecuador's major exports and contributes significantly to its economy. The country has substantial oil reserves and produces crude oil, which is then exported to other countries. Ecuador's oil industry is also an essential source of revenue and employment. Despite the need for oil, Ecuador has little private crude oil investing, as the State oil company handles most.


Who Could a Reduction in Ecuadorian Oil Impact
Ecuador is one of the major oil producers in South America and exports its oil to various countries worldwide. Some main destinations for Ecuadorian oil exports include the United States, China, and members of the Organization of the Petroleum Exporting Countries (OPEC), such as Colombia, Peru, and Chile. Ecuador also has trade agreements with other countries that might import its oil. The specific distribution of oil exports can vary over time based on market conditions and agreements between Ecuador and its trading partners.
Ecuador has numerous trading partners. Some of its significant trading partners include the United States, China, Colombia, Peru, and the European Union. Ecuador trades in various sectors, including oil, agriculture, manufacturing, and services. The country's trade relationships are essential for its economy and contribute to economic growth and development.
How Much of Global Oil Production?
Total global oil production is about 90 million barrels per day. The all-time high is about 95 million barrels per day which occurred in 2019 before the pandemic. The largest oil producer in South America is currently Brazil. The country is known for its significant oil reserves discovered offshore, particularly in the pre-salt layer of the Santos Basin. Brazil's national oil company, Petrobras, plays an essential role in exploration and production activities in the region.
What is the Fundamental Outlook for Oil?
The Energy Information Administration forecasts higher oil prices in H2 2023 and 2024 based on trending inventory drawdowns. They also anticipate production cuts from OPEC members and predict higher petroleum consumption to drive stockpile declines. The EIA believes inventories will decline by 0.4 million barrels per day in H2 and the balance of 2024.
How is Ecuador's Oil Customers Faring During a Global Slowdown?
The United States and China are two of Ecuador's trading partners. China has been one of the largest importers of oil in the world. In 2021 China was the second largest importer of crude oil globally, importing about 12.7 million barrels daily. Only Europe imports more crude oil than China.
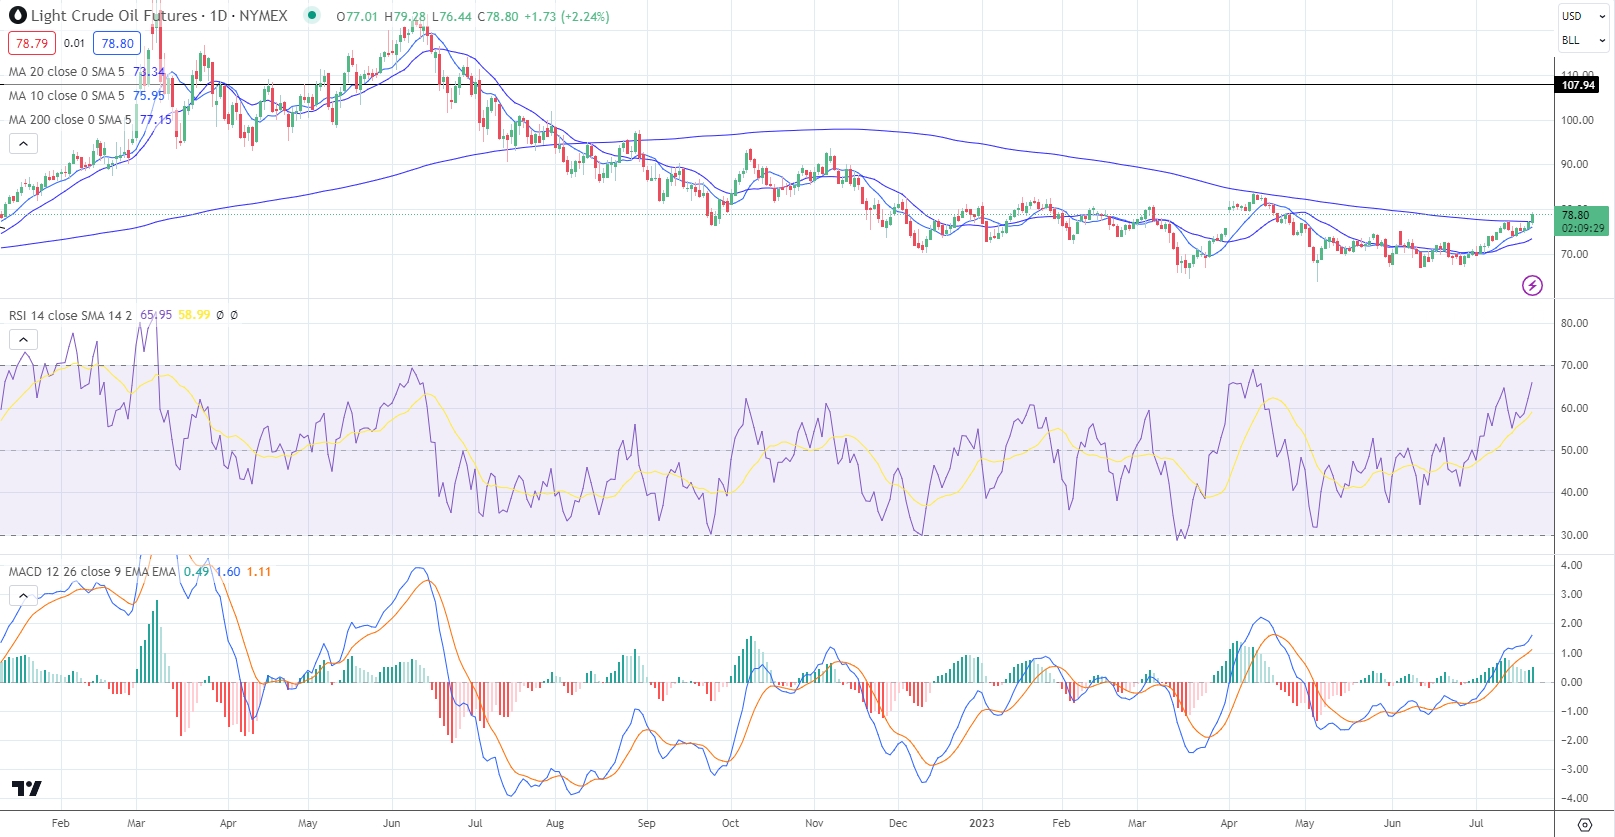
What is the Technical Outlook for Oil
Oil prices are beginning to break out above trend line resistance (see chart). Resistance in trading refers to a technical analysis term used to describe a price level at which a particular security or asset tends to encounter selling pressure, leading to a temporary halt or reversal of upward price movement. It acts as a ceiling, preventing the price from moving higher. Traders and investors monitor resistance levels to make informed decisions on when to buy or sell assets. When the price reaches a resistance level, it may indicate that market participants perceive the asset as overvalued, leading them to sell and potentially causing the price to decrease.
Prices have closed above the 200-day moving average, now seen as support. Support in trading refers to a specific price level on a chart where demand for a particular asset or security is expected to be strong enough to prevent further price declines. It is a level at which buyers are willing to enter the market, creating a "floor" for the price. Traders and investors often look for support levels to identify potential buying opportunities, as they anticipate that the price will bounce back or reverse higher from that level. Support levels are typically determined by analyzing historical price data, trend lines, moving averages, or specific technical indicators.
The 200-day moving average is a commonly used technical indicator in financial markets. It represents the average price of an asset over the past 200 trading days. Traders and investors use the 200-day moving average to analyze long-term trends and determine potential support or resistance levels. It is often considered a significant indicator as it smoothens out short-term fluctuations and provides a broader picture of the asset's price movement.
The 200-day moving average is calculated by summing up the closing prices of a particular security or index over the past 200 trading days and then dividing that sum by 200. This calculation is typically performed daily to reflect the most recent price data. The resulting average value indicates the price level the security or index has maintained over the past 200 days, helping traders identify long-term trends and potential support or resistance levels.
A moving average crossover is poised to occur. A moving average crossover is a popular technical analysis technique traders use to identify potential changes in the direction of a trend. It involves plotting two or more moving averages on a price chart and observing when they intersect or cross. The most common moving averages used in crossovers are the short-term (faster) moving average and the long-term (slower) moving average.
When the faster moving average crosses above the slower moving average, it is generally seen as a bullish signal, indicating a potential uptrend or buying opportunity. Conversely, when the faster-moving average exceeds the slower-moving average, it is typically considered a bearish signal, suggesting a potential downtrend or selling opportunity. Traders often use moving average crossovers to generate buy or sell signals, with the crossover acting as confirmation. The moving average crossover also signifies a trend.
In the context of trading, a trend refers to the general direction in which the price of a financial instrument, such as a stock, commodity, or currency, moves over time. Traders often analyze historical price data to identify patterns or trends that can help them make informed trading decisions.
One common type of trend is an uptrend, where prices generally rise over a specific period. This scenario can indicate bullish sentiment and potential buying opportunities. Conversely, a downtrend implies that prices decline, suggesting bearish sentiment and potential selling opportunities. Identifying and understanding trends is a crucial aspect of technical analysis, which aims to predict future price movements based on historical patterns.
Momentum is Accelerating
The movement in oil prices is generating upward momentum. The RSI is breaking out. RSI typically stands for Relative Strength Index. It is a popular technical indicator used in financial markets to measure the strength and momentum of a price's recent gains and losses. Traders often use RSI with other technical analysis tools to make more informed trading decisions. An RSI can also tell if a market is overbought or oversold, potentially signaling a reversal or continuation of a trend. Reading on the RSI above 70 reflects an overbought condition, while reading below 30 reflects oversold conditions.
The Bottom Line
In late July, Ecuadorian authorities confirmed an oil spill off the country's coast of 1,200 barrels into the Pacific Ocean. The beaches around the spill have been mostly cleaned up, and oil on the water is still a work in progress. The upshot is that Ecuadorian oil is needed to continue to keep the supply/demand balance of oil in check. Prices are starting to move higher. The technical outlook is positive, and most countries are expected to see positive growth in 2023 and 2024.


