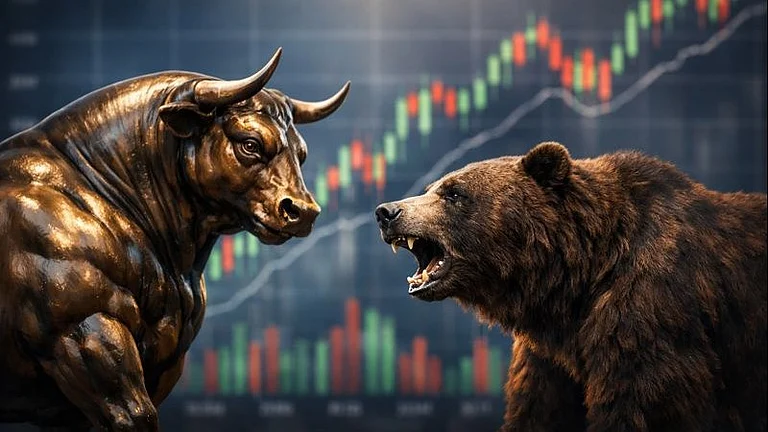
Indian equity indices closed slightly higher today marginally down from the record high it touched in early trade. The benchmark index of the Bombay Stock Exchange (BSE) The BSE Sensex touched a new high of 80,392 points but closed at 80,049 up 0.08 per cent from the previous close. At the current growth rate, if bulls continue to dominate the market, the Sensex can touch the 1 lakh mark by July 2026.
Remarkable Growth
The Sensex has surged 10 per cent in just 20 trading sessions, the fastest growth in its history. Though this rapid rally is driven by macroeconomic fundamentals, expectations of US Fed rate cuts, and pro-growth government policies, the speed at which the index is crossing new barriers makes sceptics feel it is too good to believe. It jumped from 70,000 to 80,000, the fastest 10,00 point rally too in less than 7 months or 139 sessions.
As of today, Year-to-date the Sensex has gained nearly 11.06 per cent.
When Can Sensex Hit 1 Lakh Mark?
Considering the base value of Sensex at 100 in 1979, the 30-stock index shows a 16.1 per cent historical CAGR in 45 years. However, the CAGR has been going down in the last few years due to a low base effect. For instance, if we take the CAGR of the initial 40 years of the Sensex journey it is 19.5 per cent and in the last five years since the pandemic, CAGR has gone down to 14 per cent.
So after accounting for the trend of dip in CAGR, on the lower side, we can expect Sensex to rise 12 per cent CAGR and it will take 2 years for it to touch the 1 lakh mark by July 2026.
The cyclical nature of Senses is such that it showed negative returns at least every four years in the last 20 years. Always a year of substantial gains followed after a notable loss. Noteworthy rises include an 81.47 per cent gain from 2003 to 2004, a 70.78 per cent rise from 2005 to 2006, and a 77 per cent increase after the 2008 economic crisis.
Also, the index faced significant dips (38 per cent) during the global financial crisis, and a 24 per cent decline during the Covid-19 pandemic. Periods of robust growth are often followed by corrections or downturns and the last correction was during the Covid-19 pandemic. Amid the ongoing surge, financial experts are advising to be mindful of considerable froth in small-cap and mid-cap space and avoid making substantial investments in the riskier segments of the market.


